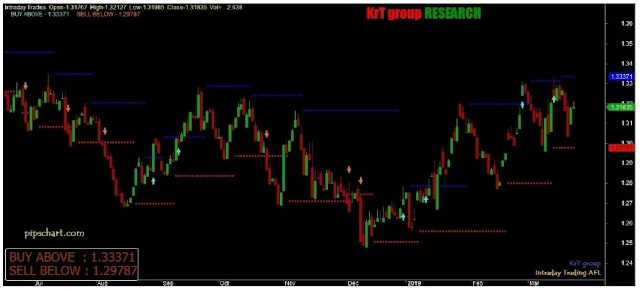
Mọi nhà giao dịch trong ngày luôn tìm thấy một afl amibroker trong ngày tốt nhất. Nhưng kết quả afl tốt nhất cho giao dịch trong ngày không dễ để duy trì giao dịch. Vì đây là giao dịch trong thời gian ngắn, nên việc tìm ra afl giao dịch trong ngày với mục tiêu và mức dừng lỗ không dễ dàng. Hôm nay chúng ta sẽ nói về AFL giao dịch trong ngày cho amibroker, một công cụ rất phổ biến trong thế giới giao dịch trong ngày.
AFL này sử dụng để hoãn màu
(như xanh lam và đỏ) để hiểu mức hỗ trợ và kháng cự trong ngày. Ngoài ra còn có
một số mũi tên để chỉ ra điểm chốt thực tế. Phần quan trọng nhất của AFL này là
ở góc dưới bên trái, nó hiển thị điểm mua ở trên và điểm bán ở dưới, giúp bạn
có nhiều lựa chọn hơn để nhận ra. Hy vọng điều này hữu ích cho mọi nhà giao dịch
trong ngày. Lưu ý rằng nếu bạn là nhà giao dịch ngoại hối hoặc giao dịch với thị
trường ngoại hối thì tốt hơn là sử dụng khung thời gian lớn để có kết quả tốt
nhất.
Nếu bạn xem hình ảnh ở trên, bạn
có thể thấy điều gì xảy ra và khi nào thì giao dịch. Afl đề cập rõ ràng Mua
trên và Bán dưới điểm giao dịch. Vì đây là giao dịch trong ngày nên trong hầu hết
các trường hợp, nó cung cấp cho bạn điểm giao dịch. Chỉ cần làm theo điểm được
đề cập và giao dịch với điểm đó.
_SECTION_BEGIN("Ami");
GfxSetBkMode(1);
X=750;
Y=1;
Font=10;
GfxSelectFont("Impact",Font*2.2,
550);GfxSetTextColor(colorRed);GfxTextOut("KrT group",x,y);
GfxSelectFont("Impact",Font*2.2,
550);GfxSetTextColor(colorGreen);GfxTextOut("RESEARCH",x+120,Y);
_SECTION_END();
//------------------------------------------------------------------------------
Version(5.20);
xx=BarIndex();x=xx;Lx=LastValue(x);
nbar=Param("N Pivot Bars",3,2,50,1);
npiv=Param("N Pivots lookback
period",1,1,50,1);
PivotSymmetry=ParamToggle("Use
Symmetric Pivots","Off|On",0);
CleanPivots=ParamToggle("Use
Clean Pivots","Off|On",0);
srStyle=ParamToggle("S/R
Style","Off|On",1);
if (PivotSymmetry)
{
fc=1;
pk=H>Ref(HHV(H,nbar*fc),-1)
AND Ref(HHV(H,nbar),nbar)<=H;
pk=pk AND Lx-ValueWhen(pk,x)>nbar*fc;
tr=L<Ref(LLV(L,nbar*fc),-1)
AND Ref(LLV(L,nbar),nbar)>=L;
tr=tr AND Lx-ValueWhen(tr,x)>nbar*fc;
}
else
{
fc=2;
pk=H>Ref(HHV(H,nbar*fc),-1)
AND Ref(HHV(H,nbar),nbar)<=H;
pk=pk AND Lx-ValueWhen(pk,x)>nbar*fc;
tr=L<Ref(LLV(L,nbar*fc),-1)
AND Ref(LLV(L,nbar),nbar)>=L;
tr=tr AND Lx-ValueWhen(tr,x)>nbar*fc;
}
px0=ValueWhen(pk,x,0); tx0=ValueWhen(tr,x,0);
px1=ValueWhen(pk,x,1); tx1=ValueWhen(tr,x,1);
px2=ValueWhen(pk,x,2); tx2=ValueWhen(tr,x,2);
px3=ValueWhen(pk,x,3); tx3=ValueWhen(tr,x,3);
ph0=ValueWhen(pk,H,0); tl0=ValueWhen(tr,L,0);
ph1=ValueWhen(pk,H,1); tl1=ValueWhen(tr,L,1);
ph2=ValueWhen(pk,H,2); tl2=ValueWhen(tr,L,2);
ph3=ValueWhen(pk,H,3); tl3=ValueWhen(tr,L,3);
if (CleanPivots)
{
pk=IIf(pk AND px0<tx0
AND ph0>ph1,False,pk);
tr=IIf(tr AND px0>tx0
AND tl0<tl1,False,tr);
pk=IIf(pk AND px2>tx1
AND ph1<=ph2,False,pk);
tr=IIf(tr AND tx2>px1
AND tl1>=tl2,False,tr);
px0=ValueWhen(pk,x,0); tx0=ValueWhen(tr,x,0);
px1=ValueWhen(pk,x,1);
tx1=ValueWhen(tr,x,1);
px2=ValueWhen(pk,x,2);
tx2=ValueWhen(tr,x,2);
px3=ValueWhen(pk,x,3);
tx3=ValueWhen(tr,x,3);
ph0=ValueWhen(pk,H,0);
tl0=ValueWhen(tr,L,0);
ph1=ValueWhen(pk,H,1);
tl1=ValueWhen(tr,L,1);
ph2=ValueWhen(pk,H,2);
tl2=ValueWhen(tr,L,2);
ph3=ValueWhen(pk,H,3);
tl3=ValueWhen(tr,L,3);
}
GraphXSpace=20;
SetChartOptions(0,chartShowDates);
SetBarFillColor(IIf(C>O,ColorRGB(0,175,0),IIf(C<=O,ColorRGB(175,0,0),colorLightGrey)));
Plot(C,"\nPrice",IIf(C>O,ColorRGB(0,175,0),IIf(C<=O,ColorRGB(175,0,0),colorLightGrey)),64,0,0,0);
//plotting circles
//PlotShapes(shapeSmallCircle*tr,IIf(Lx-ValueWhen(tr,x)>nbar,ColorRGB(0,100,0),colorWhite),0,L,-10);
//PlotShapes(shapeSmallCircle*pk,IIf(Lx-ValueWhen(pk,x)>nbar,ColorRGB(255,0,0),colorWhite),0,H,10);
if(srstyle)
{
miny=Status("axisminy");
maxy=Status("axismaxy");
for (i=1;i<=npiv;i++)
{
rr=Ref(ValueWhen(pk,H,i),-nbar);
rr=IIf(rr>maxy
OR rr<miny,Null,rr);
ss=Ref(ValueWhen(tr,L,i),-nbar);
ss=IIf(ss>maxy
OR ss<miny,Null,ss);
Plot(rr,"",colorBlue,styleNoLine|styleDots,0,0,0);
Plot(ss,"",colorRed,styleNoLine|styleDots,0,0,0);
Buy = Cross(H,rr);
Sell= Cross(ss,L);
PlotShapes(IIf(Buy, shapeUpArrow, shapeNone),colorTurquoise,
0,L, Offset=-25);
PlotShapes(IIf(Sell, shapeDownArrow,
shapeNone),colorOrange, 0,H, Offset=-25);
}
}
else
{
rr=ValueWhen(pk,H);
rr1=IIf(rr AND BarsSince(pk)>nbar,rr,Null);
rr2=IIf(rr AND BarsSince(pk)<=nbar,rr,Null);
ss=ValueWhen(tr,L);
ss1=IIf(ss AND BarsSince(tr)>nbar,ss,Null);
ss2=IIf(ss AND BarsSince(tr)<=nbar,ss,Null);
Plot(rr1,"",colorRed,1);
Plot(rr2,"",colorLightGrey,styleDots|styleNoLine);
Plot(ss1,"",colorGreen,1);
Plot(ss2,"",colorLightGrey,styleDots
| styleNoLine);
}
Title = EncodeColor(colorWhite)+ "Intraday
Trades" + EncodeColor(colorYellow) +" Open-"+O+" "+"High-"+H+" "+"Low-"+L+" "+
"Close-"+C+" "+
"Vol= "+ WriteVal(V)+"\n"+EncodeColor(colorTurquoise)+" BUY
ABOVE - "+RR+" "+EncodeColor(colorOrange)+
" SELL
BELOW - "+SS+" ";
_SECTION_END();
GfxSetBkMode( 1 );
GfxSetTextColor( colorBrown );
GfxSelectSolidBrush(colorBlack); //
this is the box background color
GfxSelectFont( "Tahoma", 20,
100 );
pxHeight = Status( "pxchartheight"
) ;
xx = Status( "pxchartwidth");
Left = 1100;
width = 280;
x = 5;
x2 = 270;
y = pxHeight;
//GfxSelectPen( colorGreen, 1); //
broader color
GfxRoundRect( x, y - 60, x2+10, y+8
, 7, 7 ) ;
//GfxTextOut( ( " Trading
System "),88,y-165);
GfxTextOut( (" "),27,y-160);
GfxTextOut( ("BUY
ABOVE : "+RR+" "), 13, y-58) ; // The text format
location
GfxTextOut( ("SELL BELOW :
"+SS+""), 13, y-30);
👉 Tải tại đây
https://drive.google.com/file/d/1fTE6nBaBJvQuxTmeWG6gP72BYhkPqu8V/view?usp=drive_link
Cách sử dụng AFL cho Amibroker
- Tải xuống tệp Amibroker AFL.
- Bây giờ hãy sao chép tệp afl và dán vào \Program Files\AmiBroker\Formulas\Custom. [Dành cho 32 bit] hoặc \Program Files(x86)\AmiBroker\Formulas\Custom. [Dành cho 64 bit]
- Vào phần công thức của Amibroker và bạn sẽ thấy afl trong thư mục Custom.


